Clinical Comparison of Low and High Injection Volumes of High-viscosity Bone Cement Used in Percutaneous Vertebroplasty
Article information
Abstract
Objective
To compare the clinical effects of different injection volumes of high-viscosity bone cement (polymethylmethacrylate, PMMA) used in percutaneous vertebroplasty (PVP) on the treatment of osteoporotic vertebral compression fractures (OVCF).
Methods
A total of 44 patients with OVCF, who underwent PVP in our neurosurgery clinic, were retrospectively reviewed. Data of the patients were obtained from electronic patient records. Patients were divided into two groups, each consisting of 22 patients, based on the injection volume of PMMA: low-volume (Group 1) and high-volume (Group 2). Group 1 received ≤4 mL (3–4 mL) PMMA whereas Group 2 received >4 mL (4.5–6 mL) PMMA. Both groups were compared in terms of age, gender, visual analog scale (VAS) score, Oswestry disability index (ODI) score, length of stay (LoS) in the hospital, and preoperative anterior vertebral height (AVH).
Results
There was no significant difference between the groups in terms of age, gender, LoS, and preoperative AVH. Postoperative first-month, sixth-month, and first-year VAS and ODI scores were observed to be significantly improved in both groups compared to the preoperative period. However, no significant difference was observed between the groups in terms of preoperative and postoperative VAS and ODI scores.
Conclusion
The PMMA volumes of 3–4 mL and 4.5–6 mL applied in the present study have been observed to have good and similar effects in the treatment of OVCF.
INTRODUCTION
The incidence of osteoporotic vertebral compression fracture (VCF) has increased with the increased average life expectancy in recent years. Nowadays, percutaneous vertebroplasty (PVP), a minimally invasive technique, has been widely used for the treatment of painful acute VCFs. In this technique, polymethylmethacrylate (PMMA) is injected into the vertebral corpus, and PMMA increases stability at the fracture site. It further reduces pain with its thermal necrosis effect and chemotoxic effect on intraosseous pain receptors [1].
The incidence rate of PMMA leakage has been reported to range from 5% to 80%. Studies, in which it is assessed using computed tomography (CT) scanning, have reported the incidence of leakage to be 63% to 87% [2].
The majority of PMMA leakages do not usually cause clinical symptoms, but serious complications such as nerve root compression or pulmonary embolism may occur if PMMA leaks into the spinal cord, nerve root or blood vessel. Therefore, the injection volume of high-viscosity PMMA in the treatment of VCF is still controversial3). In practice, the smaller the bone cement injection volume is, the lower the risk of complications is. Therefore, it may be safer to reduce the injection volume of the bone cement if the same clinical effect can be achieved with low PMMA injection volumes.
The aim of this study was to compare the clinical effects of different injection volumes of high-viscosity PMMA used in PVP on the treatment of osteoporotic VCF (OVCF).
MATERIALS AND METHODS
1. Study Design
This single-center, retrospective, comparison study examined the data of 44 patients with OVCF, who underwent PVP in our neurosurgery clinic between 2016 and 2019. Data of the patients were obtained from electronic patient records. Written permission was obtained from the head physician of the clinic before the study and written informed consent was obtained from all patients before surgery. All patients were evaluated with magnetic resonance imaging (MRI) before surgery. They were divided into two groups, each consisting of 22 patients, based on the injection volume of PMMA: low-volume (Group 1) and high-volume (Group 2). Group 1 received ≤4 mL (3–4 mL) PMMA whereas Group 2 received >4 mL (4.5–6mL) PMMA (Figure 1). Both groups were compared in terms of age, gender, visual analog scale (VAS) score, Oswestry disability index (ODI) score, length of stay (LoS) in the hospital, vertebral level and preoperative anterior vertebral height (AVH) (%).

Preoperative sagittal T1-weighted and sagittal flair thoracic MRI images and postoperative axial thoracic CT (upper figures) of a group 1 female patient. Preoperative sagittal T1-weighted and sagittal flair lumbar MRI images and postoperative axial lumbar CT (lower figures) of a group 2 female patient.
Patients with single-level acute OVCF in the thoracic and lumbar levels, who had AVH collapse of ≤50% and did not respond to treatment despite receiving conservative treatment for at least four weeks, were included in the study. Exclusion criteria were the presence of burst fracture and infection, coexistence of radicular findings, more than 50% collapse in AVH, primary vertebral bone tumors and spinal metastases.
2. Procedural Technique
All surgeries were performed in the operating room and under sedo-anesthesia. Patients were placed in the prone position under the guidance of C-Arm fluoroscopy. Cefazolin sodium of 1 g was administered intravenously (IV) for systemic antibiotic prophylaxis half an hour before surgery. High-viscosity PMMA was injected into the vertebrae through the pedicle. The postoperative PMMA leakage was evaluated using CT or anteroposterior (AP) and lateral radiographs.
3. Data Collection
Pain scores and functional disabilities of the patients were measured using the visual analog score (VAS) and Oswestry Disability Index (ODI), respectively, in the preoperative period and postoperative first month, sixth month, and first year. Furthermore, age, gender, LoS and preoperative AVH of the patients in both groups were also recorded.
4. Statistical Analysis
Data were expressed as mean, standard deviation (SD), frequency and percentage. Continuous variables (age, LoS, and preoperative AVH) were compared using independent samples t-test and categorical variables (gender) were compared using Fisher’s Exact Test. Independent samples t-test, repeated measures ANOVA and Post-Hoc Tests were used for the comparison of VAS and ODI scores between the groups. A p-value of <0.01 was considered statistically significant. Statistical analysis was performed using SPSS along with JASP.
5. Ethical Approval
This study received permission from Chief Physician to use data (approval number: 22.07.2020/372).
RESULTS
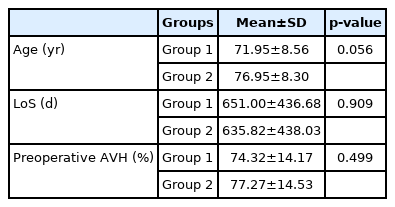
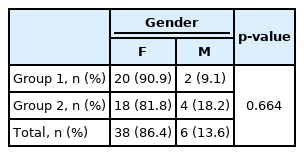
Forty-four patients underwent single-level PVP at T7–L4 levels. A total of 75% of the cases were observed to be clustered at T12–L2 levels. Demographic data of the patients are summarized in Table 1 and 2. There was no statistically significant difference between the groups in terms of age, gender, VAS and ODI scores, LoS and preoperative compression ratio.
The results of independent samples t-test performed to compare age, LoS, and preoperative AVH variables between the groups are given in Table 1. The results showed that there was no statistically significant difference between the groups in terms of age (p=0.056), LoS (p=0.909), and preoperative AVH (p=0.499).
Table 2 shows the results of Fisher’s Exact Test, which was conducted for the gender comparison between the groups. The analysis showed that there was no statistically significant difference between the groups in terms of gender (p=0.664).
Table 3 shows the results of the independent samples t-test performed to compare the preoperative and postoperative VAS and ODI scores of the groups. No statistically significant difference was observed between the groups in terms of preoperative (p=0.054), postoperative first-month (p=0.697), sixth-month (p=0.555), and first-year (p=0.420) VAS scores. Similarly, there was no statistically significant difference between the groups in terms of preoperative (p=0.034), postoperative first-month (p=0.457), sixth-month (p=0.430), and first-year (p=0.411) ODI scores.
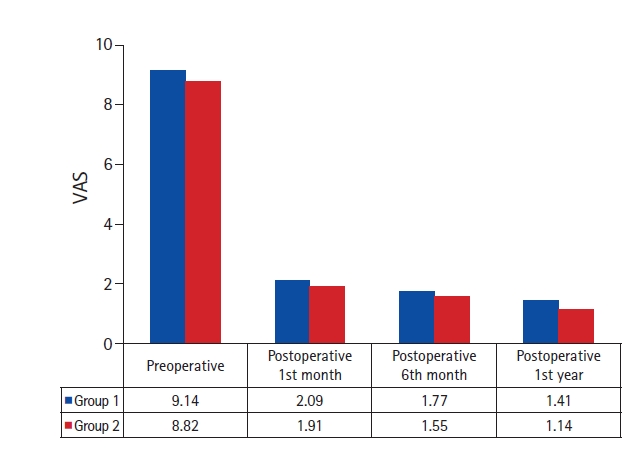
Figure 2 shows a visual analysis of the changes in VAS scores by groups. In both groups, it was observed that there was a significant decrease in VAS scores in the postoperative first month and that VAS scores remained almost the same in later times.
Variance analysis findings of the changes observed in VAS scores before and after the intervention were as follows. The difference observed in VAS scores over time was found to be significant (p<0.001, partial η2=0.97) whereas the difference observed between the groups (p=0.416, partial η2=0.02) and the difference observed between the groups over time (p=0.971, partial η2=0.00) were not statistically significant. In other words, VAS scores of the patients were observed to be changed after surgery, but this change did not differ between the groups. Comparisons were analyzed with Bonferroni corrections to determine which measurements the difference was between. The analysis showed that there was a statistically significant difference between the preoperative VAS scores and postoperative first-month (pbonf<0.001), sixth-month (pbonf<0.001), and first-year (pbonf<0.001) VAS scores. However, no statistically significant difference was observed between the postoperative first-month values and postoperative sixth-month values (pbonf=0.130), and between the postoperative sixth-month values and postoperative first-year values (pbonf=0.057) whereas there was a statistically significant difference between the preoperative values and postoperative first-month (pbonf<0.001) values. In other words, a significant decrease was observed in the VAS values of the patients in the first month following the intervention, and this decrease was observed to remain constant in the following months.
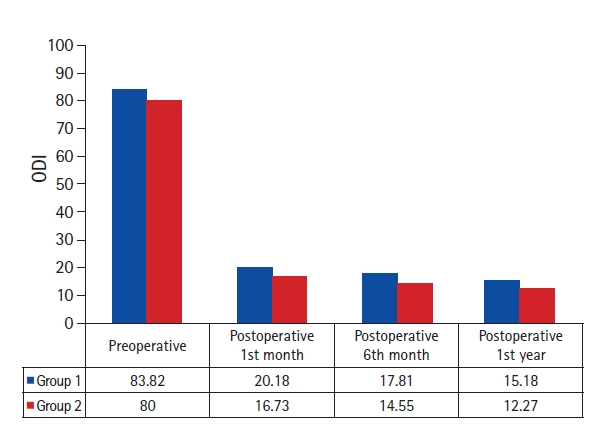
Figure 3 shows a visual analysis of the changes in ODI scores by groups. In both groups, it was observed that there was a significant decrease in ODI scores in the postoperative first month and that ODI scores remained almost the same in later times.
Variance analysis findings of the changes observed in the ODI scores before and after the intervention were as follows. The difference observed in ODI scores over time was found to be significant (p<0.001, partial η2=0.97) whereas the difference observed between the groups (p=0.305, partial η2=0.03) and the difference observed between the groups over time (p=0.990, partial η2=0.0) were not statistically significant. In other words, ODI scores of the patients were observed to be changed after surgery, but this change did not differ between the groups. Comparisons were analyzed with Bonferroni corrections to determine which measurements the difference was between. The analysis showed that there was a statistically significant difference between the preoperative ODI scores and postoperative first-month (pbonf<0.001), sixth-month (pbonf<0.001), and first-year (pbonf<0.001) ODI scores. However, no statistically significant difference was observed between the postoperative first-month values and postoperative sixth-month values (pbonf=0.610), and between the postoperative sixth-month values and postoperative first-year values (pbonf=0.464) whereas there was a statistically significant difference between the preoperative values and postoperative first-month (pbonf<0.001) values. In other words, a significant decrease was observed in the ODI values of the patients in the first month following the surgery, and this decrease was observed to remain constant in the following months.
DISCUSSION
Percutaneous vertebroplasty is widely used throughout the world, particularly in elderly patients, for osteoporotic, traumatic, and pathological VCFs [4]. Bone cement leakage is one of the most common complications of the PVP procedure. It may result in neurological losses by causing spinal cord and nerve root damage and may leak into the blood vessel, causing pulmonary embolism. Surgical instruments, bone cement material used, and the dosage and time of bone cement injection are important parameters to prevent leakage during PVP [5]. High-viscosity PMMA polymerizes at lower temperatures. It reaches high viscosity in a short time and can be injected slowly [6].
In some studies, the complications of PVP have been associated with high-dose PMMA injection whereas there are also studies reporting no relationship between the complications and the dose of injected cement. It has been suggested that there is a relationship between the leakage and consistency of PMMA. The authors have reported that injecting bone cement after waiting for some time when there is leakage leads to solidification and less PMMA leakage [7,8]. In another study conducted in 2002, it was found that epidural leakage of PMMA after PVP was dose-dependent and that the amount of PMMA injected increased, the incidence of leakage also increased [9]. Since there was no PMMA leakage that could cause serious complications in the present study, no comparison was made.
In a recently published study involving 130 patients, who underwent percutaneous vertebral augmentation, all patients received 2- to 6-mL cement injections per vertebra during the procedure, and PMMA leakage to the vena cava was found in two cases and to the intervertebral disc was found in eight patients [10]. In another recent study comparing high-viscosity bone cement and low-viscosity bone cement, in which PVP was performed in a total of 80 patients with single-level OVCF, no statistically significant difference was observed in terms of VAS and ODI scores whereas high-viscosity bone cement was reported to cause less PMMA leakage [11]. In the present study, the absence of serious bone cement leakage in both groups may be attributed to the fact that high-viscosity PMMA, which is more effective and safer, has been preferred.
In a study published in 2016, cement injection volume was shown to have a positive dose-response correlation with the incidence of PMMA leakage and the degree of pain relief after PVP and thus, it was recommended that the cement should be injected into the vertebrae as much as possible during the PVP procedure [12]. Different results may have been obtained in the present study since the patients have been divided into two groups according to the injection dose and different PMMA injection volumes have been compared.
In a study published in 2019, the incidence of adjacent vertebral fractures was reported to increase when PMMA injection volume exceeded 40.5% of the vertebral body [13]. Therefore, this finding should be considered when injecting large amounts of PMMA. Optimal result with small volumes of PMMA should be the main objective.
The mean amount of injected cement varies in different studies mostly from 1.5 to 5.3 mL14). In the present study, the mean amount of PMMA injected was 3.7 mL and 4.9 mL in Group 1 and Group 2, respectively. The values compared are compatible with the literature data. There is a volume difference of 1.2 mL between the mean values in both groups.
In the literature, there are several studies comparing kyphoplasty with vertebroplasty and unilateral PMMA injection with bilateral PMMA injection [15-20]. There are many studies in this regard; however, the number of studies comparing the clinical results of different PMMA injection volumes is quite limited.
1. Limitations
This study was conducted as a single-center study and had a relatively small sample size. Therefore, there is a need for large-scale multicenter studies.
CONCLUSION
In conclusion, the present study has shown that there is no significant relationship between injection volume of high-viscosity PMMA and clinical efficacy. Furthermore, good clinical results can be achieved with low injection volumes like 3–4 mL. Considering that it causes less leakage, bone cement injected at low doses may be considered as the first choice in the treatment of OVCFs.
Notes
No potential conflict of interest relevant to this article.


