Comparative Study of the Differences in Radiologic Results for Percutaneous Endoscopic Lumbar Foraminotomy and Microscopic or Micro-endoscopic Lumbar Foraminotomy
Article information
Abstract
Objective
Lumbar foraminal stenosis is a common pathology that causes back pain and radiculopathy. Percutaneous endoscopic lumbar foraminotomy (PELF) is a minimally invasive surgical procedure reported to be effective in the treatment of foraminal stenosis; however, no studies have been conducted that compare the on radiographic results of PELF and conventional techniques for the treatment of foraminal stenosis, such as microscopic foraminotomy and micro-endoscopic foraminotomy. This study aimed to report postoperative changes in the lumbar foraminal parameters on computed tomography (CT) after PELF and to compare the radiological efficacy of the PELF technique with that of the conventional techniques.
Methods
Radiographic evaluation of the neuroforamen was based on CT scans taken preoperatively and 3 months postoperatively in the PELF and conventional groups. The Japanese Orthopaedic Association (JOA) score for back pain, visual analog scale (VAS), and JOA back pain evaluation questionnaire (JOABPEQ) were evaluated preoperatively and at 3 months postoperatively in the PELF group.
Results
The PELF and conventional groups comprised 21 and 17 patients, respectively. In the PELF group, the JOA score, VAS of back pain, and JOABPEQ of low back pain showed significant improvement. There were significant increases in the foraminal area, superior foraminal width (SFW), and middle foraminal width (MFW). Additional radiological evaluation for patients who underwent microscopic or micro-endoscopic lumbar foraminotomy was almost equivalent.
Conclusion
Percutaneous endoscopic lumbar foraminotomy is a minimally invasive technique that is as effective as conventional techniques for the treatment of foraminal stenosis.
INTRODUCTION
Lumbar foraminal stenosis is a common pathology that causes radiculopathy and back pain. Conventional surgical methods for the treatment of lumbar foraminal stenosis, categorized as microscopic or micro-endoscopic lumbar foraminotomy, have been the gold standard [1].
Recently, minimally invasive spinal surgical methods have been developed to improve preservation of the surrounding anatomical structures. Previous randomized controlled studies have reported the effectiveness of percutaneous endoscopic lumbar discectomy [2,3]. Some authors have reported good clinical results in patients with foraminal stenosis treated with percutaneous endoscopic lumbar foraminotomy (PELF) [4]. To our knowledge, no studies have been conducted on radiographic assessments comparing PELF with conventional techniques such as microscopic foraminotomy and micro-endoscopic foraminotomy.
The aims of this study were to report postoperative changes in lumbar foraminal parameters on computed tomography (CT) after PELF and to compare the radiological efficacy of the PELF technique with that of conventional techniques, such as microscopic and micro-endoscopic foraminotomy.
MATERIALS AND METHODS
The study protocol was approved by the Institutional Review Board of Izumi City General Hospital (No.20-J25).
1. Patient Population
All the study participants provided informed consent. This study included patients who underwent PELF at our institution between June 2019 and November 2020 and were followed up for more than 3 months postoperatively. Patients with radicular pain and signs of radiculopathy with imaging studies showing foraminal stenosis at the level and side corresponding to the patient’s symptoms were included in this study, and patients with definitive segmental instability were excluded. Patients who underwent either microscopic or micro-endoscopic lumbar foraminotomy at our institution between 2008 and 2018 were assigned to the conventional group, which was the control group.
2. Surgical Procedure (Percutaneous Endoscopic Lumbar Foraminotomy)
The procedure was performed under general anesthesia using motor-evoked potentials. The patient was placed in the prone position on a radiolucent table. An 8-mm transverse skin incision was made 5–7 cm lateral to the midline. A spinal needle was inserted toward the lateral surface of the facet joint using X-ray fluoroscopy. An obturator was inserted over the guidewire, which was passed through the needle, and fixed to the foramen. The main aspect of this surgery was removal of the hypertrophied part of the facet using an ultra-thin high-speed burr [5]. Foraminal unroofing was performed until the ligamentum flavum, and epidural fat began to appear (Figure 1, 2).
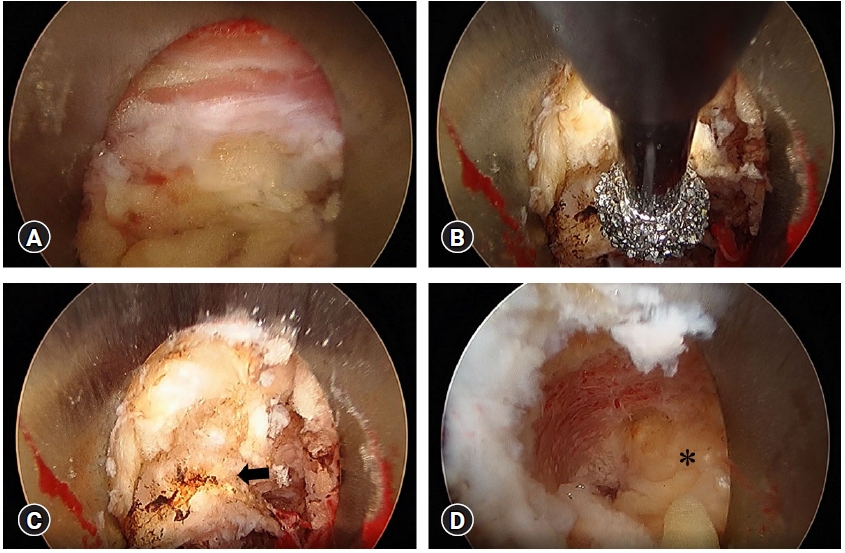
Endoscopic views of the surgical procedures. (A) The first endoscopic view reveals connective tissue, fat and capsular ligaments. (B) Arrow shows the hypertrophied part of the facet. (C) Removing the hypertrophied part of the facet using an ultra-thin high-speed burr. (D) Foraminal unroofing was performed until the ligamentum flavum (asterisk) appeared.
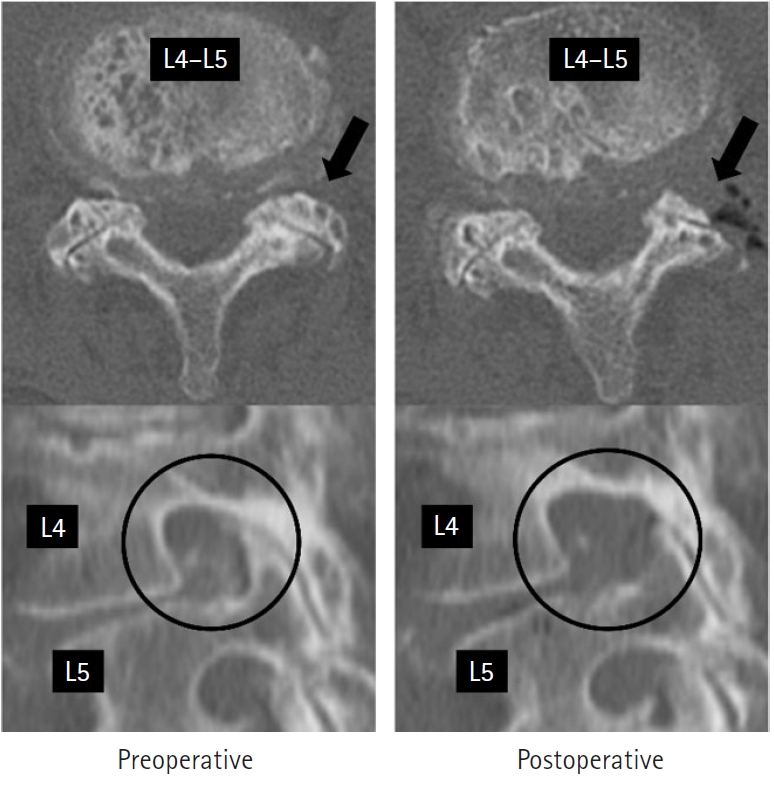
Computed tomography findings in an 81-year-old female who underwent percutaneous endoscopic lumbar foraminotomy at L4–L5. The location of the foraminotomy is shown on the axial slice (arrows) and sagittal slice (circles).
3. Clinical Evaluation
The Japanese Orthopaedic Association (JOA) score for back pain (on a scale of 0=worst to 29 points=best) was recorded preoperatively and at 3 months postoperatively [6]. Two patient-oriented questionnaires were taken, which included questions on the pain and quality of life of the patients. The scores of these, along with those for the visual analog scale (VAS) score for back pain, leg pain, and leg numbness [7], and the JOA Back Pain Evaluation Questionnaire (JOABPEQ), were evaluated preoperatively and 3 months postoperatively [8]. The JOABPEQ has five functional scores for the following domains: lower back pain, lumbar function, walking ability, social life function, and mental health [9]. Clinical evaluation was performed only for the PELF group.
4. Radiographic Evaluation
Radiographic evaluation of the neuroforamen was performed using the CT scans that were taken preoperatively for all patients for surgical planning and taken 3 months postoperatively for the evaluation of the decompression of foraminal stenosis. The images were reconstructed as sagittal slices after examining the 1.0 mm axial CT scans. According to the method described by Ahn et al. [10], the parameters of neuroforamen were defined as follows: “Foraminal area (FA) refers to the cross-sectional area at the slice that shows the maximum stenosis on sagittal section; foraminal height (FH) refers to the maximum distance between the inferior margin of the pedicle of the superior vertebra and the superior margin of the pedicle of the inferior vertebra; superior foraminal width (SFW) refers to the maximum anteroposterior width in the superior parts of the foramen; middle foraminal width (MFW) refers to the width of the central part of the foramen measured at the level of the middle height of the disc” [10] (Figure 3). The parameters of the neuroforamen were measured by two spine surgeons.
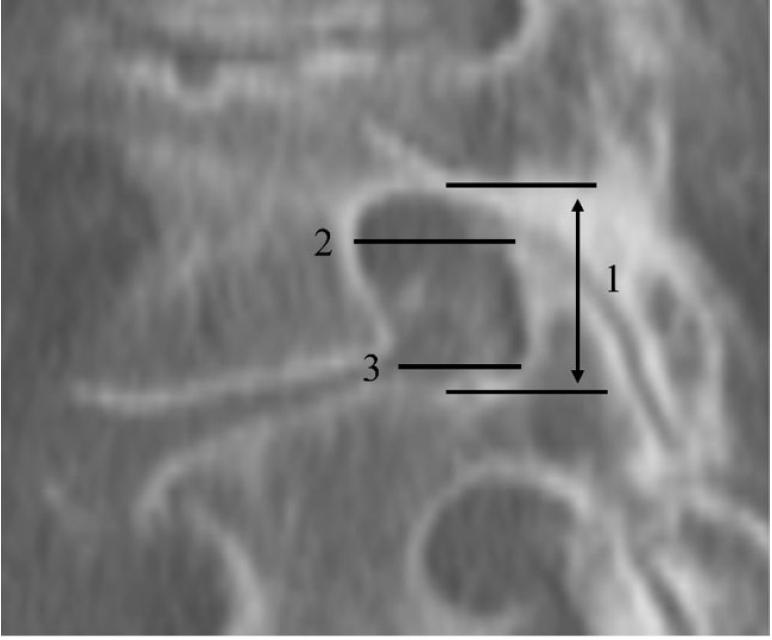
Measurement of foraminal dimensions on sagittal lumbar CT images. 1: Foraminal height (FH), 2: Superior foraminal width (SFW), 3: Middle foraminal width (MFW).
5. Statistical Analysis
All analyses were performed using the Microsoft Excel 365 software. Statistical significance was set at p<0.05. We compared preoperative and postoperative foraminal parameters using the Mann–Whitney U-test and performed Spearman’s rank correlation analysis to assess interobserver agreement.
RESULTS
1. Demographics and Clinical Results
The PELF group consisted of 21 patients (7 men, 14 women; mean age at surgery 74.1±7.1 years), while the conventional group consisted of 17 patients (6 men, 11 women; mean age at surgery, 71.6±10.0 years). The following lumbar levels (L) were operated upon in the PELF group: L2/3 (n=1), L3/4 (n=6), L4/5 (n=20), and L5/S, (n=7) and L3/4 (n=2), L4/5 (n=7), and L5/S (n=10) in the conventional group. Operation time per neuroforamen and intraoperative blood loss showed no significant difference between the 2 groups. The baseline characteristics of the participants assigned to each treatment group are presented in Table 1.
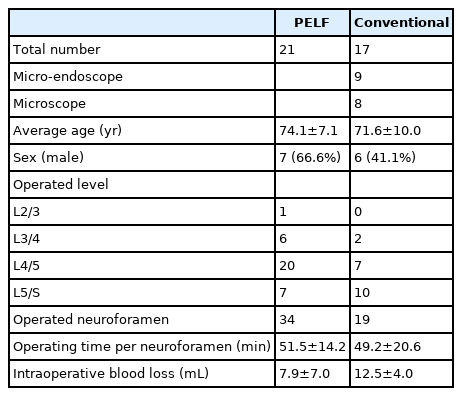
Patient demographics
The postoperative values for the JOA score, VAS score for back pain, and JOABPEQ score for lower back pain were significantly different from the preoperative values; however, VAS scores for leg pain, leg numbness, and the other components of JOABPEQ showed no significant differences postoperatively (Table 2).
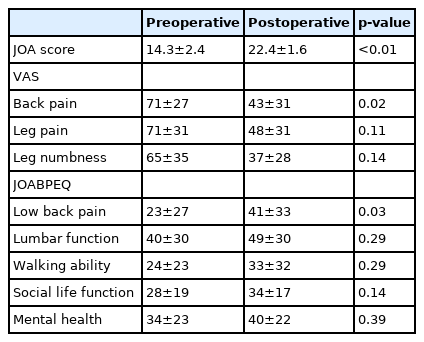
The change in clinical outcomes at 3 months after percutaneous endoscopic lumbar foraminotomy
2. Foraminal Area
The mean FA had increased in both the PELF group and conventional groups (p<0.01) (Table 3). The changes in the FA between the PELF and conventional groups showed no significant postoperative differences (Table 4). Interobserver agreement, which was measured pre- and postoperatively, was strong in the PELF group and moderate in the conventional group (Table 5).
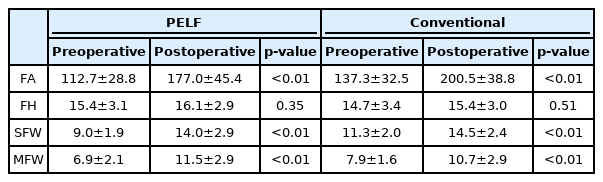
Radiographic evaluation of the neuroforamen on CT; pre- and postoperative foraminal parameters
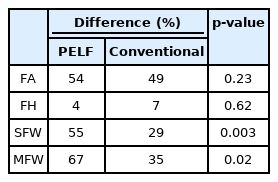
The changes in the foraminal parameters
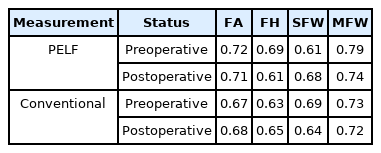
Interobserver agreement of foraminal parameters
3. Foraminal Height and Width
The changes in FH, mean SFW and mean MFW for both groups are shown in Table 3 and 4. The differences in the SFW and MFW between the PELF and conventional groups were statistically significant (Table 4). While pre- and postoperative interobserver agreement was strong between the PELF and conventional groups for MFW measurement, it was moderate in both groups for FH and SFW measurement (Table 5).
DISCUSSION
Our study is the first study that compares the differences in lumbar foraminal parameters measured after percutaneous endoscopic lumbar foraminotomy and conventional surgery. It demonstrated that the changes in the SFW and MFW were significantly different in the PELF and conventional groups; however, the differences in postoperative FH and FA between the two groups were not significant. A previous cadaveric study showed that percutaneous endoscopic lumbar foraminotomy achieved an average 56.1% increase in FA [11], which is in accordance with our clinical results, which showed a 54% increase in foraminal area. The PELF technique uses a tubular retractor with a diameter of 8 mm, which is difficult to use because of the restricted operatory working space, and it limits the visual field [12]. On the other hand, the microendoscopic laminotomy (MEL) technique uses a tubular retractor with a diameter of 16 mm, which makes tilting it during surgery difficult because of its larger diameter compared to the tubular retractor used in the PELF technique. Furthermore, the MEL and PELF techniques using an oblique-view lens facilitate access to the foramen and decompression of the FA, which is not possible during microscopic lumbar foraminotomy. Thus, PELF is as effective as conventional surgical procedures for foraminal decompression.
Our study also demonstrated that the FA, SFW, and MFW significantly increased postoperatively in both the PELF and conventional groups, while FH remained unchanged. Our surgical plan caused this; we ensured that lumbar foraminotomy for foraminal stenosis was focused on decompression in the anteroposterior direction rather than in the craniocaudal direction.
Sairyo et al. [5] reported that partial pediculectomy decreased the lumbar facet contact area in patients with foraminal stenosis who underwent PELF and resulted in segmental surgical instability. Therefore, the PELF technique should be focused on removing the hypertrophied part of the facet and preventing segmental lumbar instability.
In our study, the JOA score, VAS score for back pain, and JOABPEQ score for lower back pain improved significantly after PELF. Ahn et al. [4] described a PELF and reported that 91% of the patients achieved good or excellent outcomes using the Oswestry disability index. Yoshimoto et al. [13] also reported that foraminal decompression alone had good outcomes, potentially eliminating the need for fusion surgery. Although the present study demonstrated that operation time per neuroforamen and intraoperative blood loss showed no significant difference between the 2 groups, the percutaneous endoscopic technique preserves the muscles and spinal structures, with patients of this technique recovering faster than those who undergo surgery using the conventional techniques [14]. Even though the PELF technique has a steep learning curve [15], it is gaining popularity as a minimally invasive surgery for foraminal stenosis with good outcomes.
1. Interobserver Agreement
In both the PELF and conventional groups, preoperative and postoperative foraminal parameters showed strong or moderate interobserver agreement, showing that effective foraminal decompression can be achieved using both PELF and conventional procedures.
2. Limitations of the Study
This study had several limitations. First, the duration of follow-up was short, and the long-term results of these procedures were unclear. Second, we performed the microscopic and micro-endoscopic lumbar foraminotomies in 2008 and could not acquire the clinical outcomes and complications in the conventional group from the patient charts; therefore, our study compared only the radiographic evaluations of the neuroforamen between the PELF and conventional groups. Third, the retrospective study design makes it difficult to exclude bias regarding patient demographics.
CONCLUSION
Our study showed that PELF achieved foraminal decompression as effectively as the conventional technique. Percutaneous endoscopic lumbar foraminotomy should be the preferred surgical technique in the treatment of foraminal stenosis, as it is minimally invasive and has a favorable outcome.
Notes
Ethical statements
The study protocol was approved by the institutional review board of Izumi City General Hospital (No.20-J25).
Conflicts of interest
No potential conflict of interest relevant to this article.
Acknowledgements
We would like to thank Editage (www.editage.com) for English language editing.