Interstage Imaging in Staged Minimally Invasive Spinal Deformity Surgery
Article information

Abstract
Objective
Spinal surgeons have developed novel minimally invasive (MIS) protocols to correct adult degenerative spinal deformities in well-selected patients. Many surgeons perform these cases in stages: first by an anterior/lateral approach for interbody device placement, and second by a posterior approach for fixation. Imaging is typically obtained in between these 2 stages to reassess the surgical anatomy. We evaluated the utility of interstage imaging by comparing alignment parameters between baseline, interstage, and final postoperative radiographs.
Methods
We reviewed MIS deformity cases performed at our institution by 3 expert surgeons, which were staged and had complete preoperative, interstage, and postoperative radiographs. Standard alignment parameters at all timepoints were compared.
Results
Thirty-three patients met the criteria for inclusion. There were significant differences between baseline and interstage values for lumbar lordosis (LL, p=0.004), pelvic tilt (PT, p=0.002), and pelvic incidence-lumbar lordosis mismatch (PI-LL, p=0.002). No significant differences existed between interstage and postoperative measurements for these sagittal parameters. Significant differences were found between interstage and postoperative values for the major Cobb angle (p=0.012) and the lumbar Cobb angle (p=0.016).
Conclusions
In staged cases, our surgeons typically obtain interstage imaging, primarily standing scoliosis films. These studies inform the final levels of instrumentation and the need for additional posterior osteotomies/decompression during stage II. Based on interstage imaging findings, most sagittal correction occurs after stage I, while coronal correction occurs after stage II.
INTRODUCTION
Adult spinal deformity (ASD) is a significant source of morbidity and reduced quality of life. Its incidence and prevalence have risen in recent decades, as developed countries experience increased lifespans and greater average population age [1]. Consequently, more deformity surgeries are being performed in older, sometimes frailer patients with good long-term outcomes; but concerns regarding perioperative morbidity remain [2].
To address this need, minimally invasive (MIS) techniques have been applied to ASD with growing popularity, in particular for patients who may not tolerate long, open surgeries with elevated blood loss and general anesthetic times. In 2014, the minimally invasive deformity (MISDEF) algorithm was introduced to guide spine surgeons in selecting appropriate candidates for MIS ASD correction [3]. Subsequently, the MISDEF2 algorithm was developed to incorporate new surgical capabilities allowed by advancing MIS techniques [4]. Durable clinical and radiographic improvements have been demonstrated after MIS ASD correction [5].
A staged approach to MIS ASD correction has been described previously [6]. In these cases, some surgeons obtain interstage imaging. However, the indications for interstage imaging, the studies obtained, and the impact on surgical plans have not yet been described. In this study, we reviewed our institution’s staged MIS deformity cases to characterize trends in interstage imaging.
MATERIALS AND METHODS
We identified patients who had undergone staged MIS ASD correction at Rush University Medical Center by 3 specialized spinal neurosurgeons. Stage I surgeries entailed interbody fusion via anterior lumbar interbody fusion (ALIF) and/or lateral LIF (LLIF). Stage II surgeries entailed posterior MIS pedicle screw placement as well as decompression or posterior MIS osteotomies (grade 1 – facetectomies, or grade 2 – Ponte) when indicated, that were performed via a tubular working channel. We collected data regarding demographics, medical comorbidities, operative characteristics, and radiographic measurements preoperatively, interstage, and postoperatively.
At each of these timepoints, we reviewed standing 36-inch scoliosis films. Using standard methods, we measured pelvic incidence (PI), lumbar lordosis (LL, L1-S1), lower lumbar lordosis (LLL, L4-S1), PI-LL mismatch (PI-LL), pelvic tilt (PT), sacral slope (SS), sagittal vertical axis (SVA), C7-central sacral vertical line (C7-CSVL), major coronal Cobb angle (i.e., the Cobb angle between terminal vertebra of the deformity in the coronal plane), lumbar coronal Cobb angle, and the change in these measurements between timepoints. Angular measurements are given in degrees; linear measurements are given in millimeters.
We performed statistical analyses by Student t-test for continuous variables (shown as mean±standard deviation) or chi-square test for categorical variables (shown as No. [%]), as appropriate. Comparisons were considered statistically significant for p≤0.05. This study was approved by the Institutional Review Board (IRB) of Rush University Medical Center (IRB No. 21092202).
RESULTS
We identified 33 patients from our institution who met the criteria for inclusion. The population characteristics are given in Table 1. Average age was 67.0±7.0 years. Roughly half of the patients were female (54.5%). On average, patients were hospitalized for 7.6±2.0 days in total, with a median 2±1.6 days between stages. Final radiographic follow-up was at 21.8±25.0 months postoperatively (after stage II).
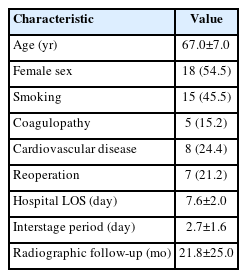
Population characteristics (n=33)
Operative details are given in Table 2. On average, stage I surgeries spanned 4.0±0.9 disc levels, with a fairly even distribution of ALIF/LLIF across patients. Stage II surgeries spanned an average 6.1±1.4 instrumented vertebral levels, with fewer levels requiring decompression and/or osteotomy. On average, final constructs spanned from L1±1.3 levels to S1±0.7 levels. Across the sample, 45.5% of constructs extended to the thoracic spine rostrally, and 9.1% included the pelvis caudally.
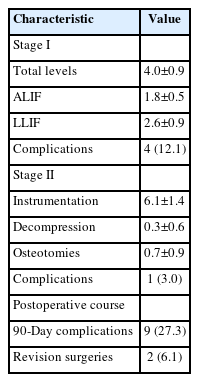
Operative characteristics and hospital course
Five patients sustained surgical complications. In 1 patient, an L1 compression fracture was sustained during stage I, noted on interstage imaging. In another patient, there was a renal injury during the stage I lateral approach. This patient was monitored after stage I and ultimately cleared by urological surgery to proceed for stage II. In another case, a misplaced screw during the stage II procedure violated the pleura, resulting in a small pneumothorax which was monitored and did not require intervention. One patient sustained large-volume venous bleeding during a stage I procedure, but no source of bleeding was identified, leading to procedure abortion. Finally, one patient sustained a chin pressure ulcer during stage II. Nine patients sustained postoperative complications within 90 days of surgery. These included 2 superficial wound infections (one required revision) and one early screw pullout requiring revision; otherwise, these represented medical complications (e.g., venous thrombosis, postoperative encephalopathy, ileus).
We obtained interstage magnetic resonance imaging (MRI) in 17 patients (51.5%). There were no interstage MRIs obtained for unplanned indications. Of these 17 patients, only 7 were judged to require posterior decompression during stage II (41.2%) with the other patients gaining satisfactory indirect decompression from the stage I interbody procedures. Among the 16 patients without interstage MRI, 3 underwent planned posterior decompression during stage II (18.8%).
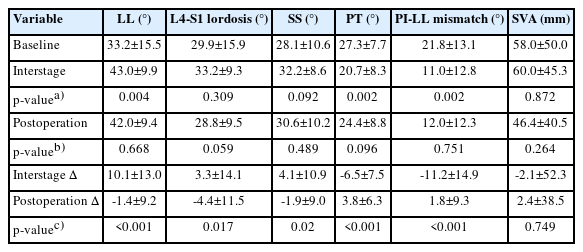
Sagittal parameters are detailed in Table 3. At baseline, our cohort had a PI-LL mismatch of 21.8±13.1 and an SVA of 58.0±50.0. Absolute values of PI-LL and LL significantly improved at interstage imaging (both p<0.01). There was no significant difference in absolute sagittal parameters between interstage and postoperative timepoints. PI-LL decreased by 11.2±14.9 after stage I, a significantly greater change than after stage II (+1.8±9.3, p<0.001). Similarly, LL increased by 10.1±13.0 after stage I, a significantly greater change than after stage II (-1.4±9.2, p<0.001). Serial sagittal measurements from a representative case are shown in Figure 1.
Sagittal parameters
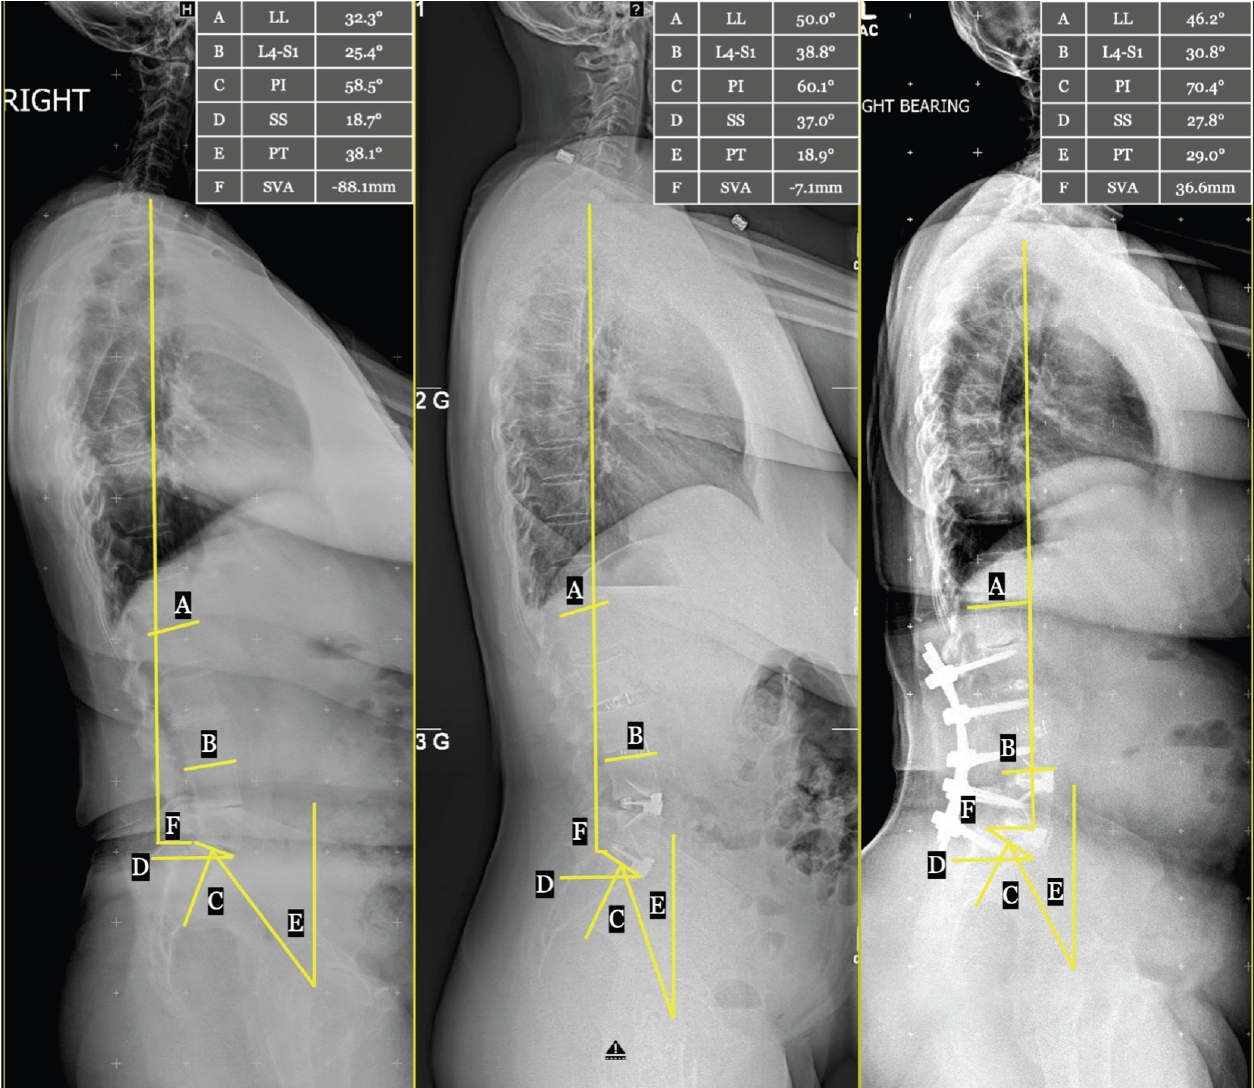
Representative case: serial lateral axis scoliosis films with sagittal plane measurements. Standing lateral axis scoliosis films in a single patient preoperatively (left), interstage (middle), and at long-term follow-up 4 years postoperatively (right). Sagittal plane alignment measurements are shown graphically, with values given in the in-set table. A, L1-S1 lumbar lordosis (LL); B, L4-S1 focal lordosis (L4-S1); C, pelvic incidence (PI); D, sacral slope (SS); E, pelvic tilt (PT); F, sagittal vertical axis (SVA).
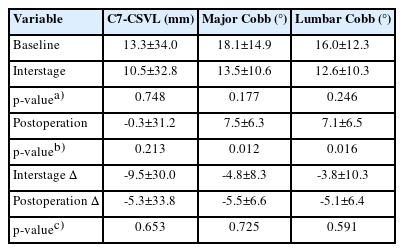
Coronal parameters are detailed in Table 4. At baseline, our cohort had a C7-CSVL of 13.3±34.0 mm, global Cobb of 18.1°±14.9°, and lumbar Cobb of 16.0°±12.3°. The values did not change significantly after stage 1. However, both global and lumbar Cobb significantly decreased after stage II (both p<0.05). Serial coronal measurements from a representative case are shown in Figure 2.
Coronal parameters
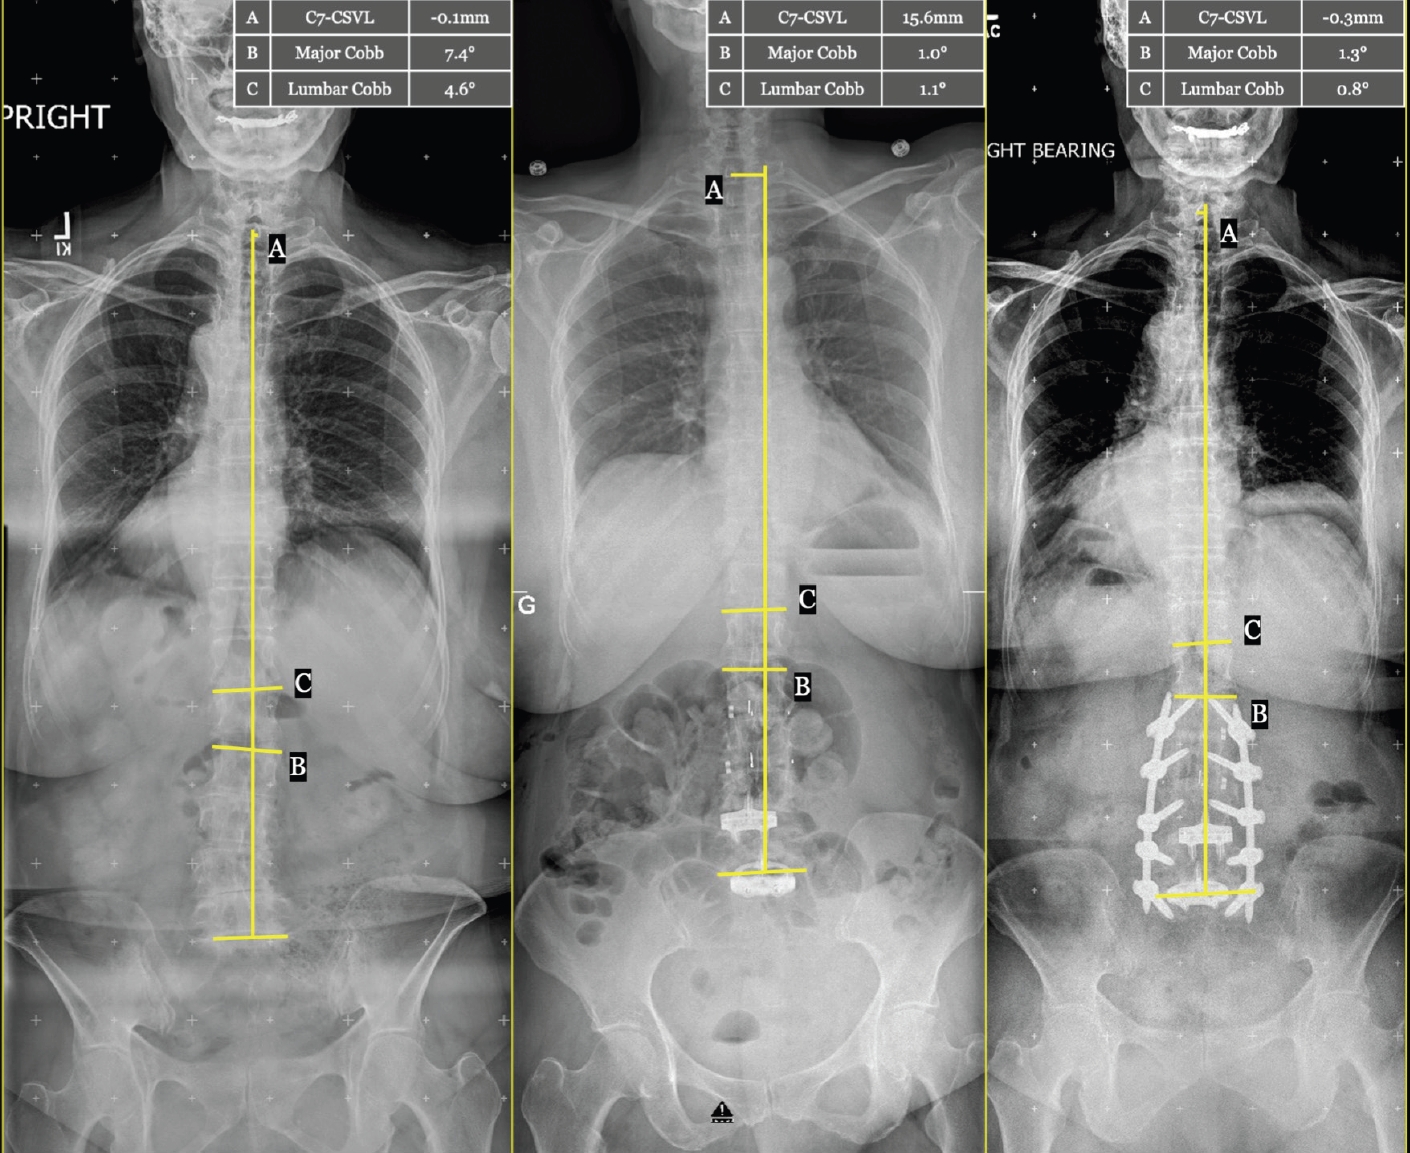
Representative case: serial anterior/posterior axis scoliosis films with coronal plane measurements. Standing anterior/posterior axis scoliosis films in a single patient preoperatively (left), interstage (middle), and at follow-up 4 years postoperatively (right). Coronal plane alignment measurements are shown graphically, with values given in the in-set table. A, C7-central sacral vertical line difference (C7-CSVL); B, major Cobb angle across the span of the deformity; C, L1-S1 lumbar Cobb angle.
Among the authors of this study, all surgeons stage MIS deformity corrections, and all obtain routine interstage imaging. All authors obtain standing scoliosis films to assess correction and for stage II planning. Two authors will obtain MRI to assess the need for further decompression during stage II, as needed (the remaining author obtains computed tomography). Our authors state that interstage imaging changes stage II plans “rarely,” “in 25% of cases,” and “in about 50% of cases,” respectively.
DISCUSSION
This is the first study to characterize the role of interstage imaging in MIS ASD correction. We report the detailed experiences of senior spinal neurosurgeons at a major academic center, including their standard practices as well as the results and impact of interstage imaging.
Many spine surgeons stage MIS ASD procedures. If the MISDEF2 algorithm is followed, stage I typically consists of an anterior and/or lateral interbody approaches to mobilize the operative vertebral segments and to introduce interbody devices for sagittal/coronal correction, indirect neural decompression, and interbody arthrodesis. Infrequently, some surgeons may perform a posterior release as a first stage to allow facet mobilization and anterior interspace distraction. This is less common today, and cases which would require this step are generally considered for open correction. In our cohort, both PI-LL and LL improved significantly from baseline on interstage imaging, as would be expected. Prior studies have shown that anterior/lateral approaches can achieve up to 10 degrees of lordosis at the L5-S1 level and 5°–6° at each rostral level [7,8]. While early MIS approaches struggled to achieve equivalent lordosis compared to open surgery, newer techniques such as anterior column realignment and expandable/hyperlordotic interbody devices have enabled significant sagittal correction with MIS surgery [9,10].
After interstage imaging and a brief recovery period (at our institution, generally 2 days between stages), stage II consists of posterior instrumented fixation, and MIS posterior osteotomies/decompression if needed. In our cohort, stage II was primarily associated with significant changes in the coronal alignment. Specifically, both the global Cobb angle and the lumbar Cobb angle decreased compared to baseline measurements after stage II surgery. Coronal correction through conventional posterior approaches has been well documented in the literature. One study demonstrated a 76% correction in the Cobb angle via staged open surgery, with anterior releases followed by posterior osteotomies/decompression in patients with severe rigid scoliosis [11]. Park et al. [12] compared a hybrid MIS/open surgery to a circumferential MIS approach to ASD correction. The authors found a significant improvement in lumbar coronal Cobb angle in both groups, with a mean correction of 13.5° in the hybrid group and 10.3° in the MIS group. In our series, we achieved an average 10.6° of coronal correction at final imaging, from a baseline 18.1° of global coronal malalignment. We believe these trends reflect appropriate patient selection for MIS ASD surgery.
The option to stage MIS ASD correction remains at the discretion of the operating surgeon. This decision should address the surgeon’s comfort/capabilities and patient-specific factors which may favor same-day versus staged surgery. A similar protocol as presented in our study was previously described by Anand et al. [6] in 2017, in which these surgeries were staged several days apart to allow for mobilization and radiographic evaluation. Further investigation comparing staged versus open ASD correction and the subsequent role of interstage imaging across multiple institutions may better elucidate formal indications for staging and obtaining interstage imaging.
This study was a retrospective review of continuous patients at a single institution, with associated biases including a single patient population, institutional/hospital norms, and nonprospective data collection reliant on chart review. By including patients treated by 3 surgeons, we hoped to introduce some heterogeneity in practice habits, thereby balancing some institutional bias. These limitations will be addressed with subsequent detailed analysis of multi-institutional cases of staged MIS ASD surgeries, with or without interstage imaging. The present work establishes a feasible basis from which to design and conduct those future studies.
CONCLUSION
Staged MIS approaches for surgical ASD correction have become increasingly common in spinal surgical practice. In staged cases, our surgeons typically obtain interstage imaging, primarily standing scoliosis films. These studies inform final levels of instrumentation and the need for additional posterior osteotomies/decompression during stage II. Based on interstage imaging findings, most sagittal correction occurs after stage I, while coronal correction occurs after stage II.
Notes
Conflicts of Interest
John E. O'Toole is a consultant at Globus Medical, Inc. and receives royalties from Globus Medical, Inc. Also, he is a stockholder of Viseon, Inc. Ricardo Fontes is a consultant and receives royalties from Globus Medical, Inc. The other authors have nothing to disclose.
Funding/Support
This study received no specific grant from any funding agency in the public, commercial, or not-for-profit sectors.
Acknowledgements
This work was presented as a poster at the 2022 Scientific Meeting of the American Association of Neurological Surgeons.